
B2B Reporting Loop for Optimisation
Move 8: Reporting Loop for Optimisation
Data and reporting on campaign and marketing progress remains a constant challenge for all companies. One of the most famous quotes in marketing is attributed to nineteenth century Philadelphia retailer John Wanamaker who said that:
“Half the money I spend on advertising is wasted; the trouble is I don’t know which half.”
Whilst that premise may be challenged by the new digital and MarTech era, it still contains more than a grain of truth even today. In fact, the tighter budgets and more niche target audiences in B2B make knowing the answer to that question even more of an imperative than in B2C. As such, reporting templates need to be flexible enough to track all channel types whilst also providing a route map for ongoing tactical adjustments. Such a template helps close the loop on the strategic model.
Monitoring the relative success of your marketing plan is even more vital for the modern B2B marketer than for counterparts in the B2C arena. It’s important that you have a template that is both easily updated and yet agile and comprehensive enough to cover every channel within your marketing mix.
In the modern era, B2B marketers within both industrial and service-driven brands are under an increasing amount of pressure to report to C-Suite/Board level executives on overall marketing progress and effectiveness. Having a template that you can lean back on in terms of quantifiable data will put you in good shape to confidently deliver such a report. There is even a stack of MarTech tools that can help automate large chunks of this process. However, it’s the interpretation of that data that’s the tricky bit, even more so in B2B where, because the volumes are inevitably lower, even the slightest variations in traffic and engagement can sometimes hint at a broader shift in behaviour.
With the above in mind, I’ve developed a three-phase approach with my team at Move Marketing Ltd over the last few years. Phase 1 outlines the objectives tracking dashboard. Phase 2 uses MarTech to gather and collate all the channel data. Phase 3 relies on analysis and interpretation to glean the insights from that data and translate it into tangible tactical adjustments or recommendations. The reporting template can be expanded or reduced to include more or less channels if required and is summarised below.
Example Reporting Template
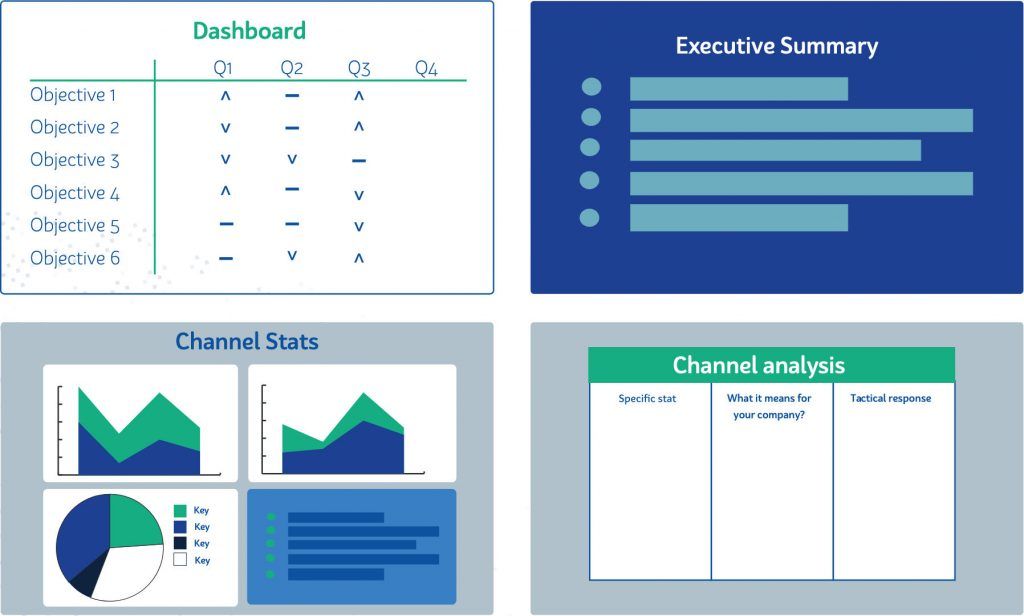
Focus on one to two slides of data charts and then one slide of summary analysis for each of the channels. This approach can be modified where one particular channel has a disproportionately high share of budget, but in most cases this ensures a balanced and concise analysis of all channels. The summary analysis slide should be split into three columns covering (a) particular stat, (b) interpretation of what this means for your company and (c) what the response to that should be. Avoid the temptation to write up several slides of interpretation or to include several slides worth of charts relating to each channel. It’s information overload and does nothing to aid the coherency of your communication to C-Suite executives on how the marketing function is performing.
In terms of frequency, it’s better to report on a quarterly basis rather than a weekly or monthly basis. This fundamentally connects back to the lower volumes of traffic and engagement typical of B2B markets – it’s much harder to pick out variations and trends in the data on short timescales whereas a quarterly comparison will give a more accurate picture from which to provide interpretation and make informed tactical decisions.
In 2017, I applied the strategic planning framework to a client of ours selling research materials into the Science and Industrial markets and operating within the £10 – £30 million turnover bracket. The company had actually spent fairly consistently and heavily on marketing over the years with six-figure budgets, but was not seeing any return from its efforts in terms of sales and margin growth. Having worked through the process we pinpointed a number of areas of opportunity in terms of drawing better value from the marketing spend at an equivalent or reduced level – a more rigorous reporting template was central to this as, historically the company was not even tracking or assessing any of the data on its channel activity. Over the last few years, we have forensically tracked these data points across around 20 individual channels on a quarterly basis, using the template model shown above. This has enabled a raft of ongoing tactical adjustments and refinements which has seen huge growth in the company’s sales and margin.
Reporting on a quarterly basis connects back to the lower volumes of traffic and engagement typical of B2B markets
The Ultimate B2B Marketing Guide